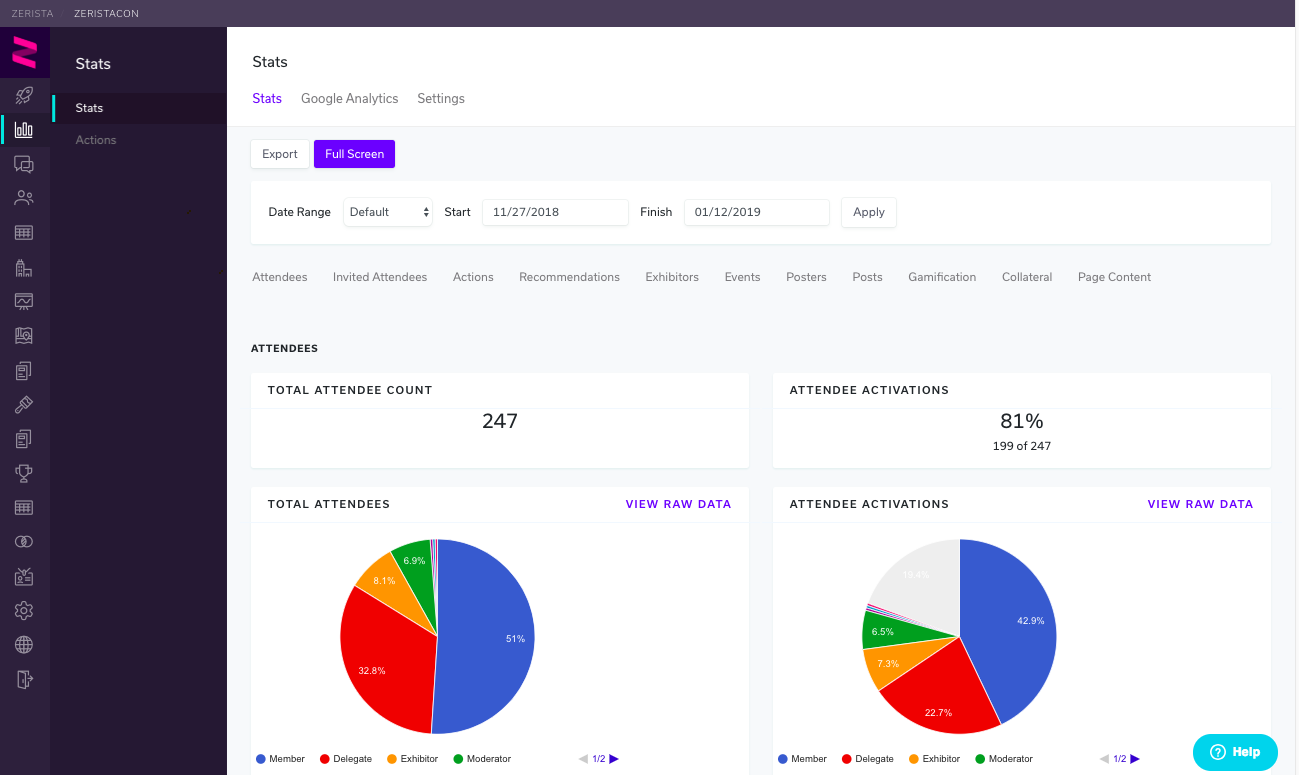
The Stats page is a tab in admin that accumulates data over a set period of time from the event app and website. Data is separated into 9 categories (see image, above) and can change depending on an app's features and date range, which can be set and adjusted from the "Settings" sub menu. The date range is the period of time in which data is collected on Stats. Typically, launch date is the start of the date range and the post-event review date is the end.
Categories:
1 - Attendees: provides data on attendee invitations, log ins, and level of user activity on the site. See who's popular by viewing "Top Attendees by Page Views." Engaged Attendees are those that performed at least one action type at least one time in the system. Very Engaged Attendees performed at least three different action types at least one time each in the system.
2 - Actions: shows which features are most popular and who uses them. The charts, here, reflect data based on attendee membership type and the totals of all actions—such as sent messages, profile updates, and requested meetings—over time.
**Note: 'Actions Breakdown by Membership' and 'Action Totals' totals will NOT match in your review of your stats. The reason for this is 'Action Totals' takes into account adding & removing actions multiple times for the same action. Example: I add a session to my schedule. I get a meeting request at the same time I need to accept. I remove the session. My meeting then gets cancelled. I decided to re-add that session to my schedule. Under 'Actions Breakdown by Membership' that counts as 'one' schedule add as the session is on my schedule. Under 'Action Totals' report that would count as two schedule adds, as I added it two separate times.
3 - Exhibitors: provides data on total exhibitor actions, log ins, collateral uploads, leads, etc. See which companies are popular by viewing "Top Exhibitors by # of Leads" or "Top Exhibitors by Page Views."
4 - Agenda: provides data on popularity of sessions and speakers based on page views and "adds" (i.e., to their schedules/contact lists) by attendees.
5 - Posters: shows the total number of posters as well as the top posters by attendee "adds" and page views. Note: If posters were not set up, data will show up blank.
6 - Posts: provides data about posts from an app's chatter section, including total number of posts as well as likes, comments, photos, and external shares.
7 - Gamification: gaming stats provided include the number of participants, leaderboard stats, and top achievements unlocked at the event.
8 - Collateral: shows "Top Collateral by Page Views."
9 - Page Content: shows which custom content pages were the viewed the most at the event.
10 - Recommendations: if enabled, provides data on exhibitor meeting recommendations, including total recommendations, confirmations, rejections, and matches.
To Export your stats, adjust your date range to your preference, then click the Export button. The system will send you an email with a zip file containing a master spreadsheet with the stats overview, as well as a separate spreadsheet for each stats category. Also, notice that the export provides additional data that is NOT shown on the stats page, as the data is truncated for optimal page loading time.
**Note: The stats page is not updated in real time. Expect a 1 hour delay.
- Click here for an overview on the Analytics Page
- Click here for an overview on Actions